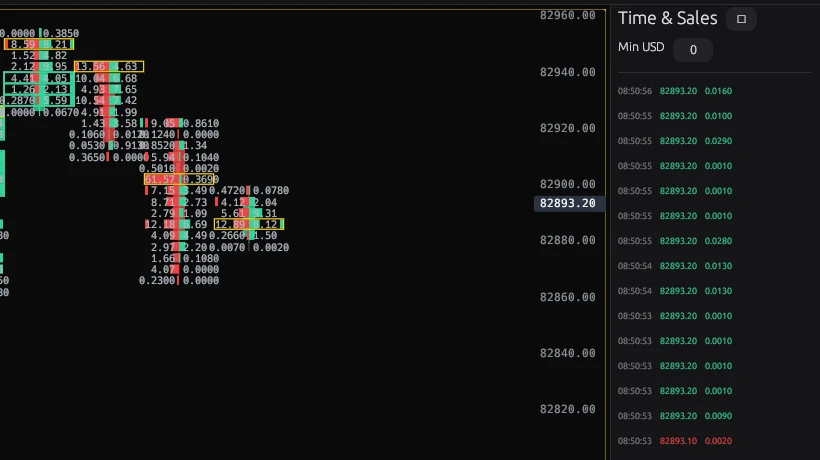
Footprint at every price level
Each cell shows how much traded into the bid and into the ask. Edge derives delta, POC and imbalance from that, and you set the imbalance threshold yourself.
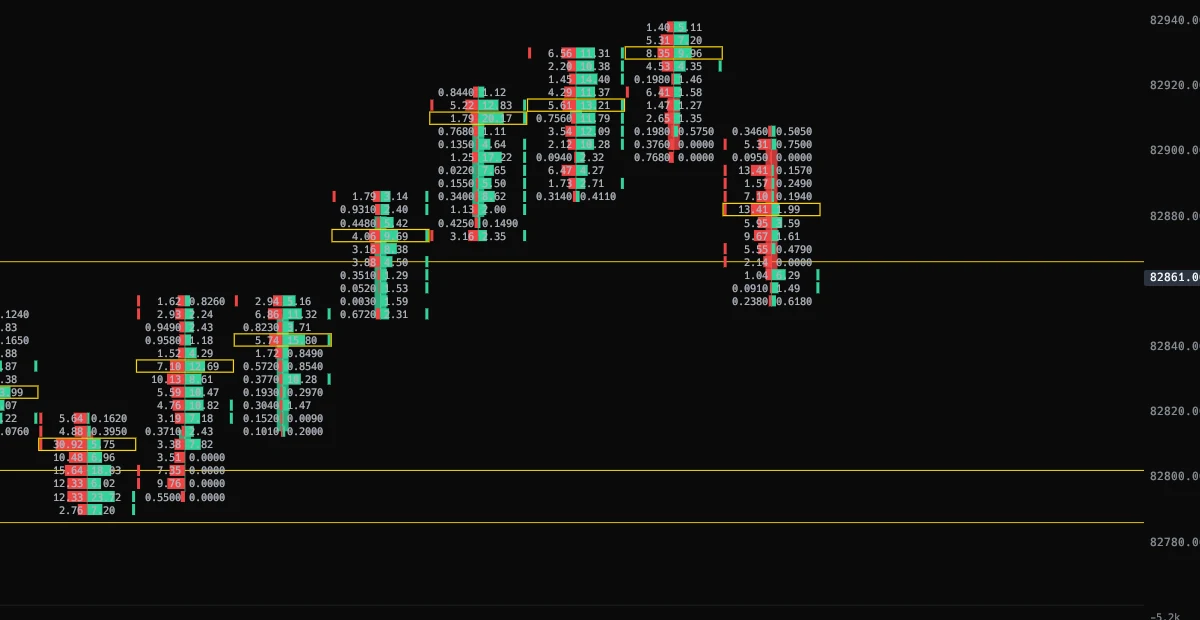
A native desktop app written in Rust. Bid and ask at every price level, order book, heatmap and liquidations in one chart.
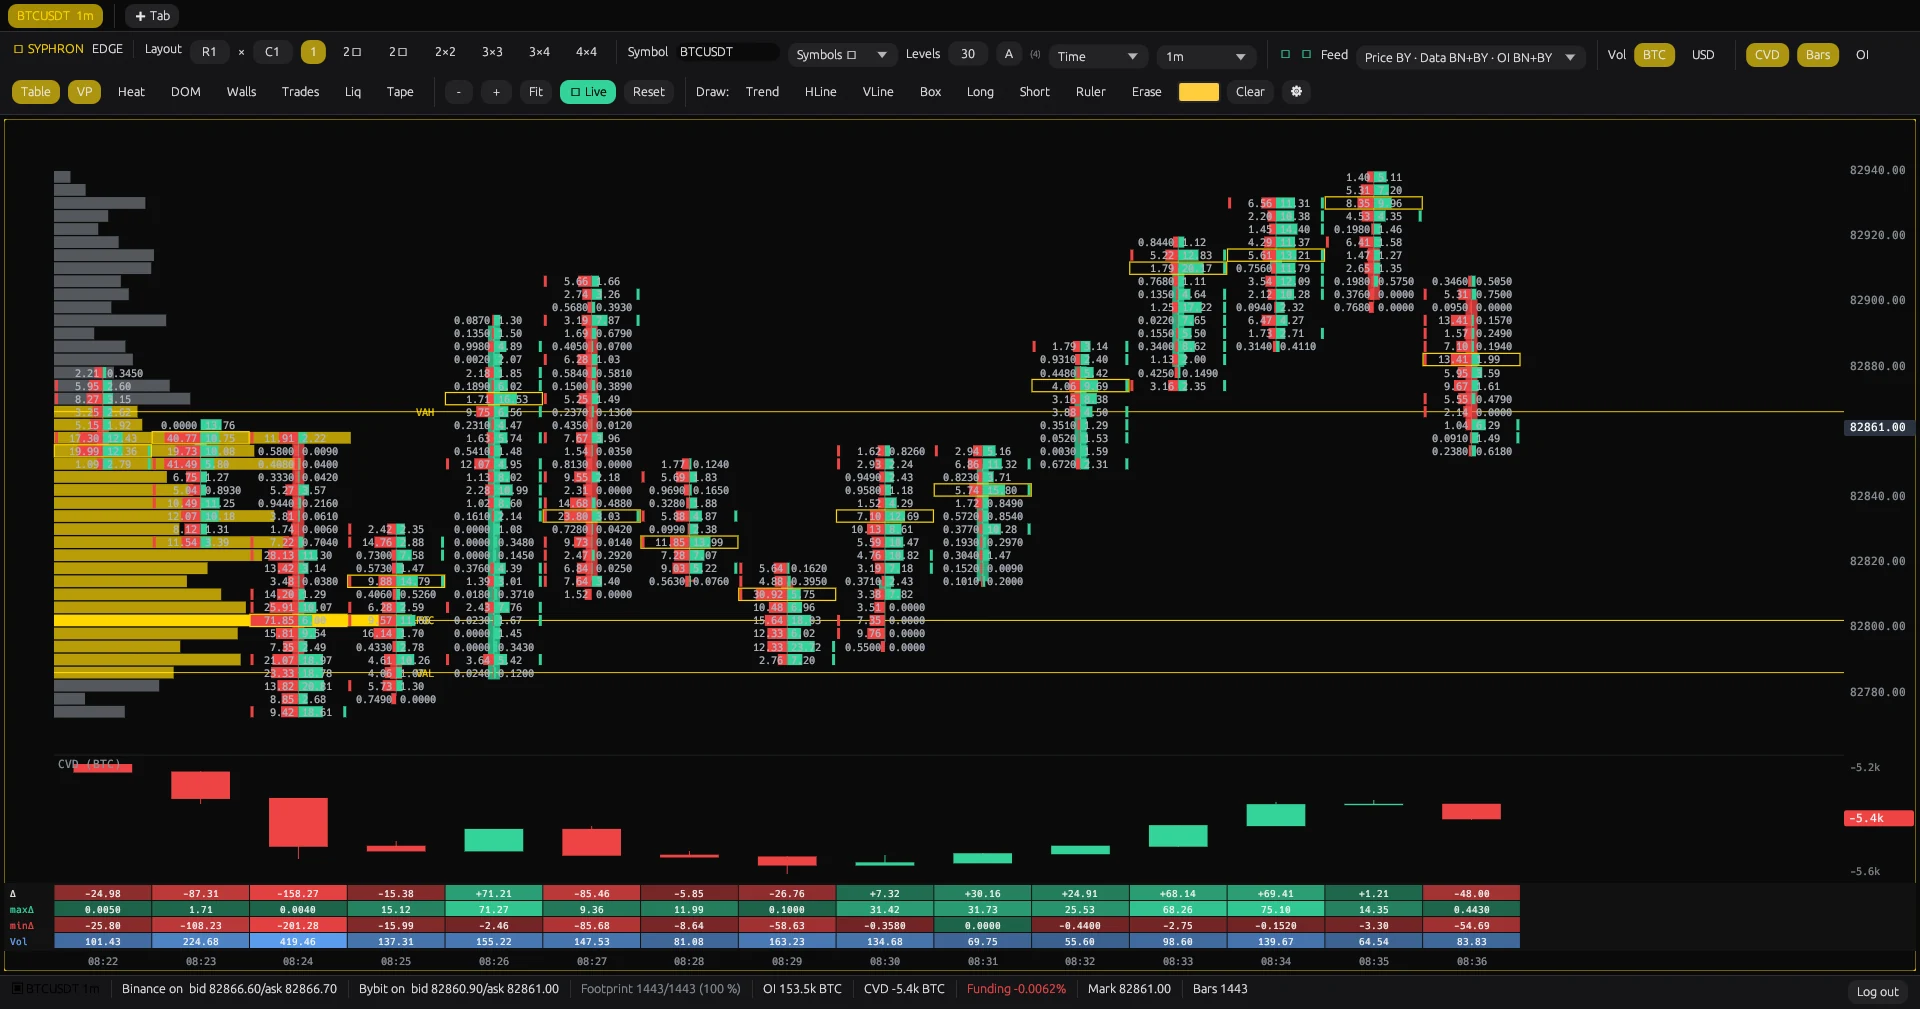
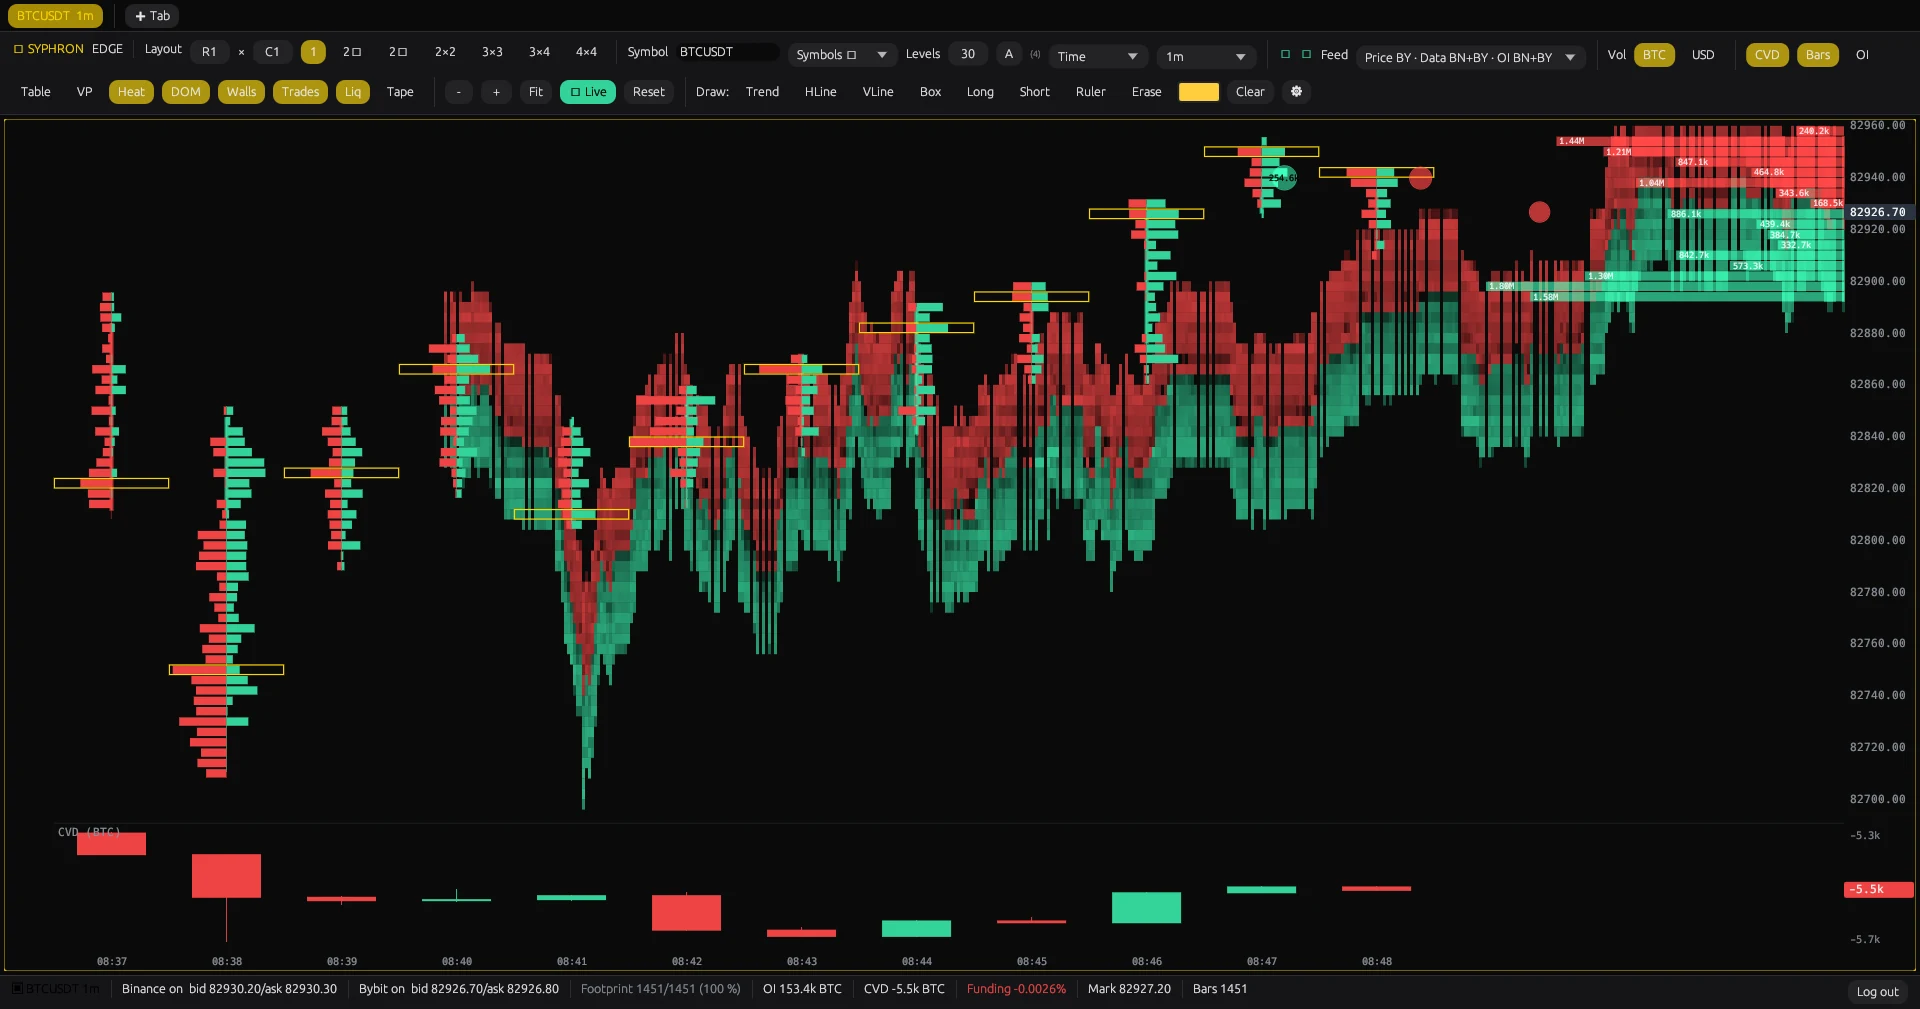
Resting limits as a heatmap, the ladder beside it, market orders as bubbles on the price. Where liquidity sits and where it gets taken out shows up in the same picture.
Each cell shows how much traded into the bid and into the ask. Edge derives delta, POC and imbalance from that, and you set the imbalance threshold yourself.
A profile across the visible range, plus the value area outward from the POC to 70 percent.
Diagonal imbalances, stacked runs and absorbed pushes are marked right on the candle.
Cumulative delta as its own candle, open interest next to it, VWAP with sigma bands anchored to the day.
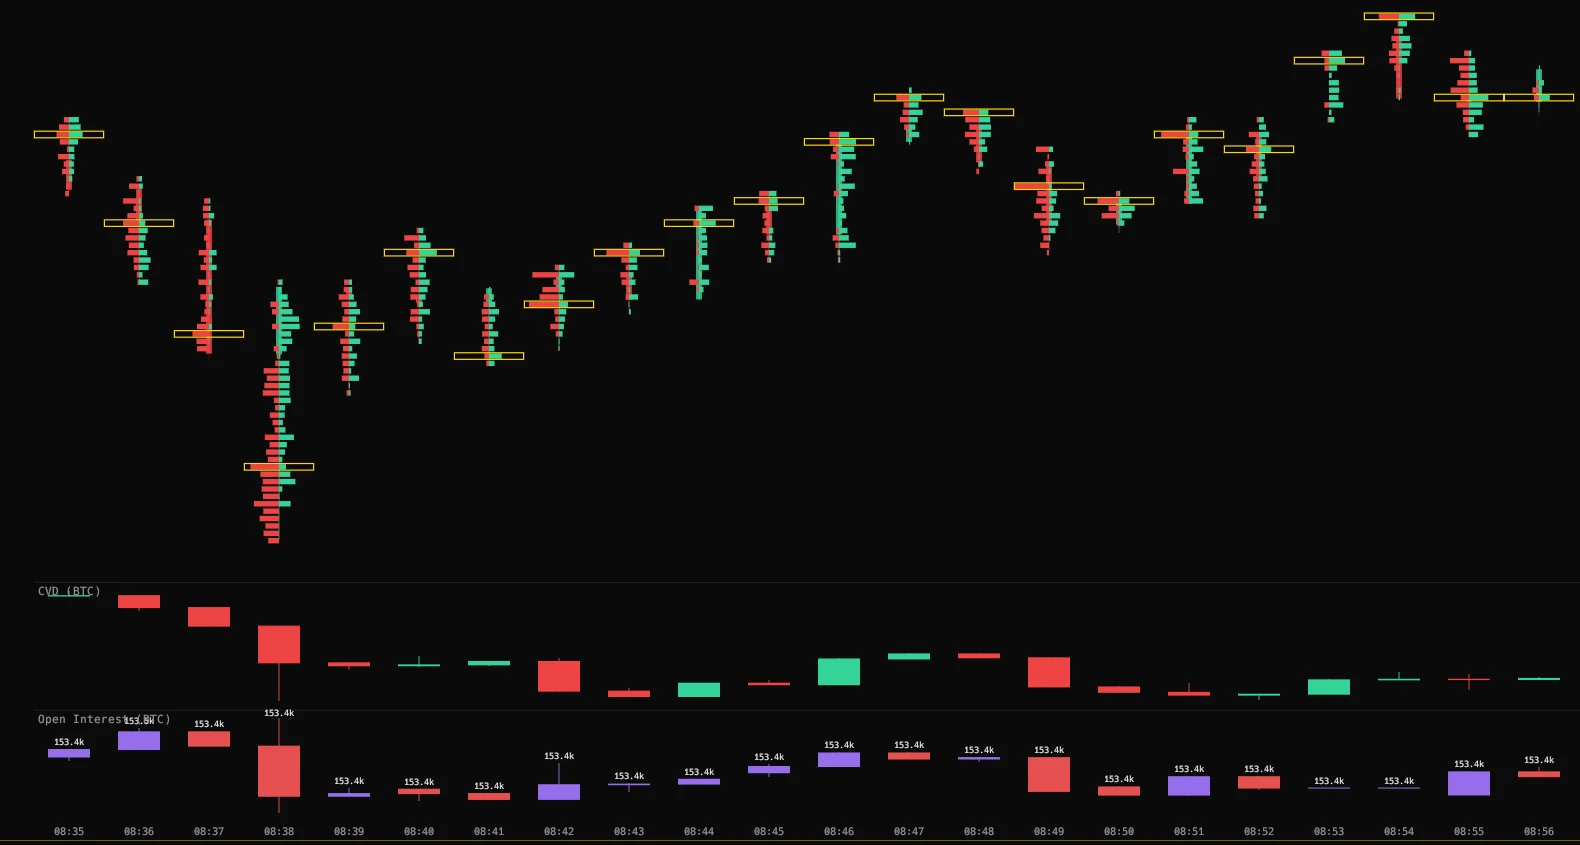
Time and sales next to the chart. Time and volume candles, with custom intervals you can define.
One day of BTCUSDT is around 1.2 million individual trades. The exchange's public interface hands those out in pages of a thousand, and below one minute it holds nothing at all.
So a service records the tape around the clock and stores it in Syphron Terminal. Edge pulls its depth from there, every single execution, not finished candles.
Download it, start it, sign in with Syphron Terminal. An administrator enables chart access for the account. The app installs nothing and keeps its recording locally, on Windows, Linux and macOS.